| Product Requirement: Insights |
Mixing Performance
This report identifies how efficiently the drums are able to mix concrete in their drum after being loaded.
It identifies how long each load takes to reach homogeneity or FULLY MIXED status. If the loads are batched correctly, the load will reach Fully Mixed status BEFORE reaching the maximum number of turns allowed. If not, then this report helps identify where the problem is. The problem could be caused by the sequence or speed that the load is batched, build up in the drum, ingredients of the mix, etc.

-
Visit the CONNEX site and enter your credentials.

-
In CONNEX, select the Insights option under the
Analysismenu.
-
On the Insights page, select the
Analysismenu.
-
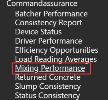
Locate the Load Assurance - Load Reading Averages option.


Filters:
- Date Range
- Plant(s)
- Truck(s)
- Job(s)
- Product(s)

The Fully Mixed status can be triggered in 3 different ways:
-
Max Turns - The load did not reach homogeneity within the maximum mixing turns allowed. The maximum turns can be set by the each company. The maximum is usually set somewhere between 75 and 100 revolutions for dry batched loads and less than 20 for wet batched loads. Any slump reading taken at this point may be inaccurate.
-
The Goal is for the probe to identify the load is homogeneous before the maximum revolutions is reached. This count of tickets should be as low as possible.
-
-
Probe Reducing Slope - As the pressure on the probe is consistently reducing, then the probe can determine the load to be fully mixed.
-
The load is homogeneous. This is considered a good result, that the load was mixed efficiently and is ready for an accurate slump reading.
-
-
Probe Stable - If the pressure is stable across multiple revolutions, the probe can determine the load to be fully mixed.
-
The load is homogeneous. This is considered a good result, that the load was mixed efficiently and is ready for an accurate slump reading.
-

Use the Column 1 and Column 2 dropdown selections to group the results as needed.
These allow multiple ways to group the results for up to 2 levels of grouping.

The Trend and Details graphs are updated according to selected filters.
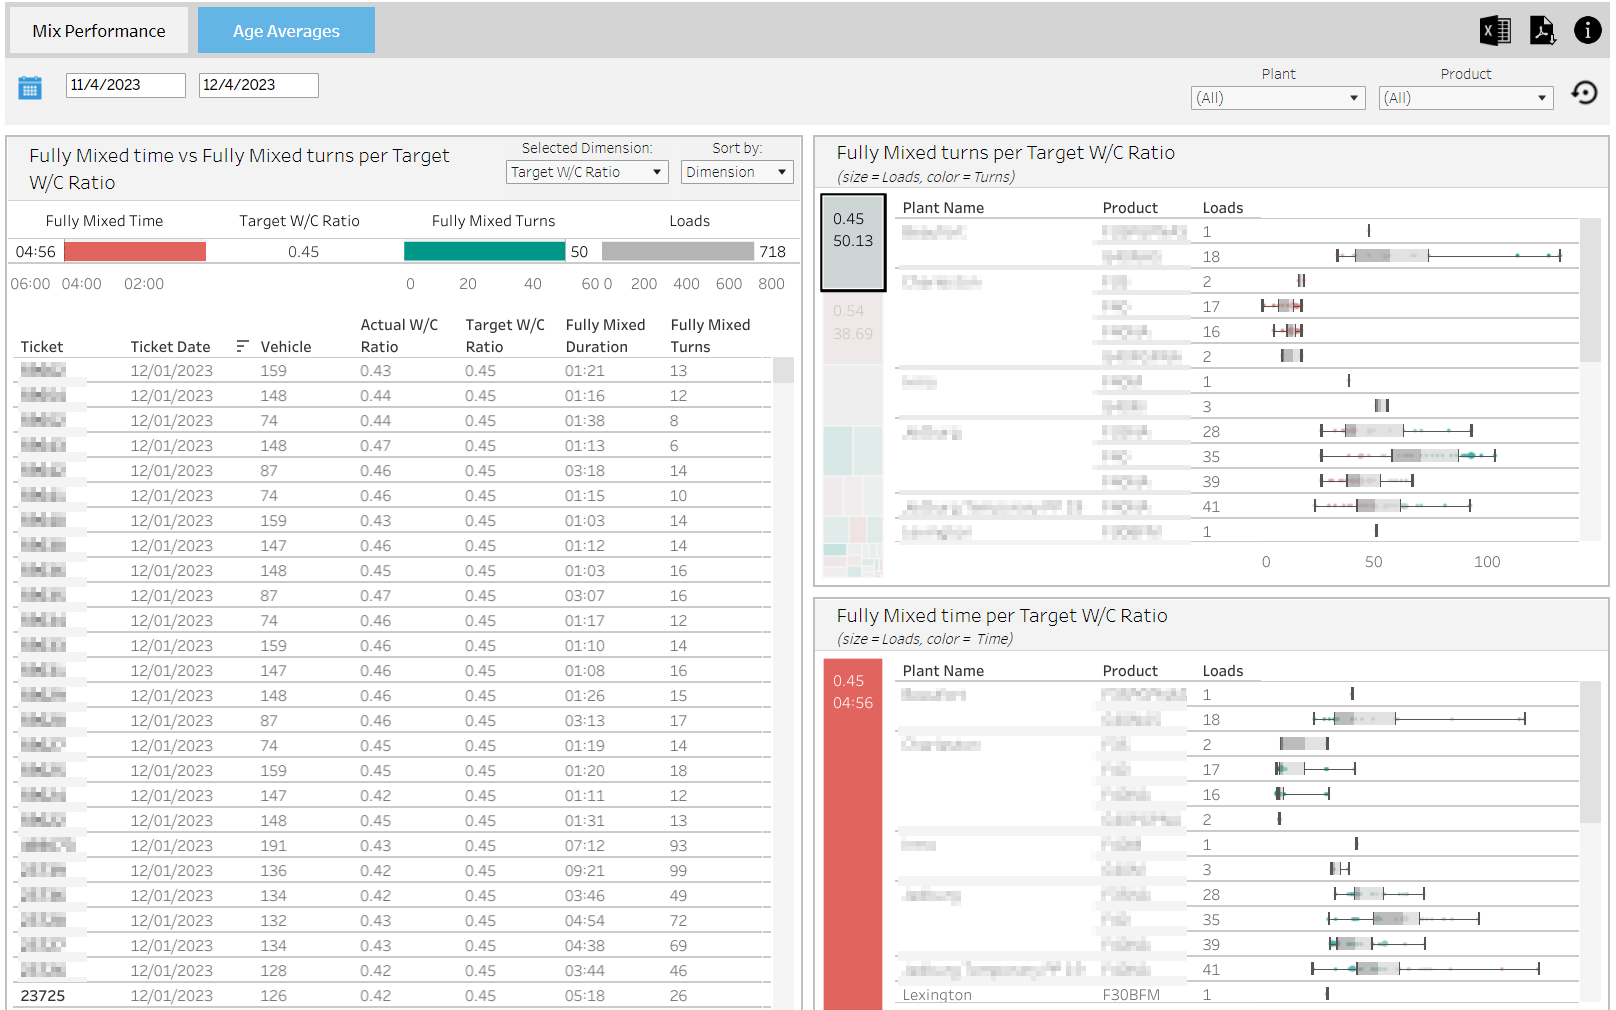
The Age Averages tab shows the average age of Fully Mixed time, and turns based on Target W/C ratio, Batched W/C Ratio, Product Code, Water Trim or Target Slump.

Group By and Sort By
-
Selected Dimension
-
Functions the same as a "Group By" and the options are: Target W/C ratio, Batched W/C Ratio, Product Code, Water Trim or Target Slump
-
-
Sort By
Additional filtering to view details
To view the details of each percentage, click on one of the 'Heat Map' squares and all charts will drill down to the details for that square.

Details: