| Product Requirement: Insights |
Batcher Performance
The Batcher Performance report provides valuable information on how plant operators are batching and how the batching affects the time spent in the yard. It allows operations to see which plant operator may need additional assistance or more training.
This report can also reveal which drivers need more training. If drivers are consistently being batched within range, why are they spending longer periods in the yard?

Batched Categories:
- Batched Within Range: +/- 1.5” of target slump
+/- 1.5" is the default setting, but it can be modified in the filter - Batched Wet: Greater than 1.5” above target slump
Greater than 1.5" is the default setting, but it can be modified in the filter - Batched Dry: Less than 1.5” below target slump
Less than 1.5" is the default setting, but it can be modified in the filter - No Reading: Driver did not get a batched slump reading
-
Visit the CONNEX site and enter your credentials.
-
In CONNEX, select the Insights option under the
Analysismenu.
-
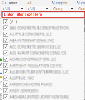
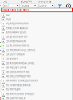
On the Insights page, select the
Analysismenu.
-
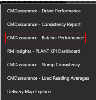
Locate the Load Assurance - Batcher Performance option.


Main Filters:
- Date Range
Filters results to the selected Date Range.
The quick filters make changing the date range easy with just one click- Yesterday - Filters results to only those from the previous day
- Last 7d - Filters results to those in last 7 days
- MTD - "Month to Date" filters results to those between the first day of the month and the current date
- Plant(s) - Filters results to loads batched from the selected plants
Remember to select "Apply" to apply the filter changes- NOTE: The list of plants can be filtered by entering text in the text box at the top of the dropdown
- NOTE: The list of plants can be filtered by entering text in the text box at the top of the dropdown
- Customer(s) - Filters results to loads batched for the selected customers
Remember to select "Apply" to apply the filter changes- NOTE: The list of customers can be filtered by entering text in the text box at the top of the dropdown
- NOTE: The list of customers can be filtered by entering text in the text box at the top of the dropdown
- Job(s) - Filters results to loads batched for the selected jobs
Remember to select "Apply" to apply the filter changes- NOTE: The list of jobs can be filtered by entering text in the text box at the top of the dropdown
- NOTE: The list of jobs can be filtered by entering text in the text box at the top of the dropdown
- Slump/Air - Changes results between Slump and Air
- Air - Results display air content accuracy
- Slump - Results display slump accuracy
- Slump Type - Filters results to the selected slump type (s)
- Slump
- Spread
- Flow


Select the icon for additional filters:

- Product Code - Filters results to loads of the selected product code(s)
Remember to select "Apply" to apply the filter changes- NOTE: The list of products can be filtered by entering text in the text box at the top of the dropdown
- Batched Slump - Filters results to loads of the selected batch result(s)
- Within Range
- Too Dry
- Too Wet
- Has Probe License - ignore this setting, it will be deprecated
- Batcher Bad Ticket Flag - Filters out tickets that have incomplete data and do not provide helpful metrics, but the bad tickets can be included for research purposes if desired.
Additional Settings in Filters dropdown list
- Slump Loss per hour - sets the slump loss rate. The slump loss rate will allow the upper limit to be higher than the threshold based on the travel time between the plant and the job site.
- The accuracy of each load is measured separately based on actual travel time.
- Example: if Slump loss rate is 1" per hour and travel time is 30 minutes. The load is still batched within range if the slump is 0.5" above the upper slump threshold.
- Batched Within Range Threshold - Sets the "Within Range" limits that dictate if a load is batched too wet, too dry, or within range.
- The values are applied to the target slump to determine the upper and lower slump limits
- Example: if +/- 1.5" and Target = 5", then the lower limit = 3.5" and the upper limit = 6.5"
NOTE: upper limit could be higher based on the "Slump Loss per hour" setting
These features are available on the Summary tab of Batcher Performance to monitor Trends and Performance.
Trend Batched %
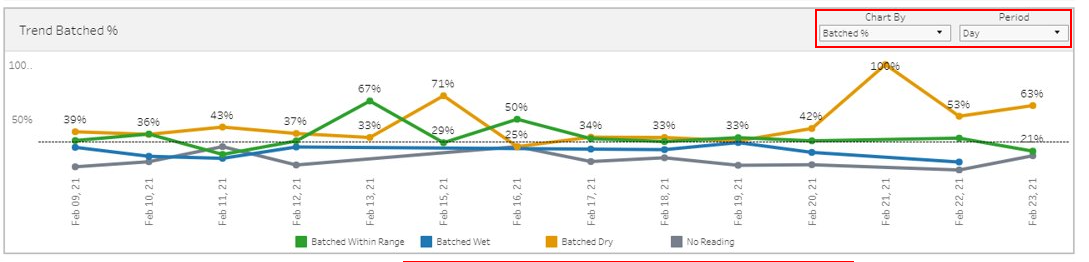
The Chart By drop-down controls what trend is charted. Two options are available:
- Batched % - The percent batched in each category
- Loaded -> To Job Duration - The time spent from loaded status until depart yard
The Period drop-down controls what time measure is used for the data point intervals. The following options are available: Day, Week, Month, Quarter, Year.
Batcher Performance per Day by Plant

The Summarize By drop-down controls how the batcher performance is summarized. Three options are available:
-
Period - Grouped by the time period set in the Trend Batched % chart
-
Plant
-
Period, Plant - Grouped by time period and then plant
The Loading to Job Threshold drop-down sets the maximum threshold. If this threshold is exceeded, the box is highlighted red.
The Details tab breaks down the results of each ticket. Data here is grouped by Plant and Date.
-
Click on an icon in the top right to export this data to Excel or PDF.