Reports > Driver Performance
The Driver Summary and Fleet Summary reports allow you to actively monitor the efforts of drivers to meet individual and company-wide performance goals that encourage improved safety, fuel economy, and maintenance costs across a fleet. Based on the goals you create, individual events like idling, hard-braking, speeding, and over-revving are logged for each driver throughout their day and made available here on demand. These occurrences are compared to the goals and compiled into a scorecard for each driver (Driver Summary) and the entire fleet (Fleet Summary).
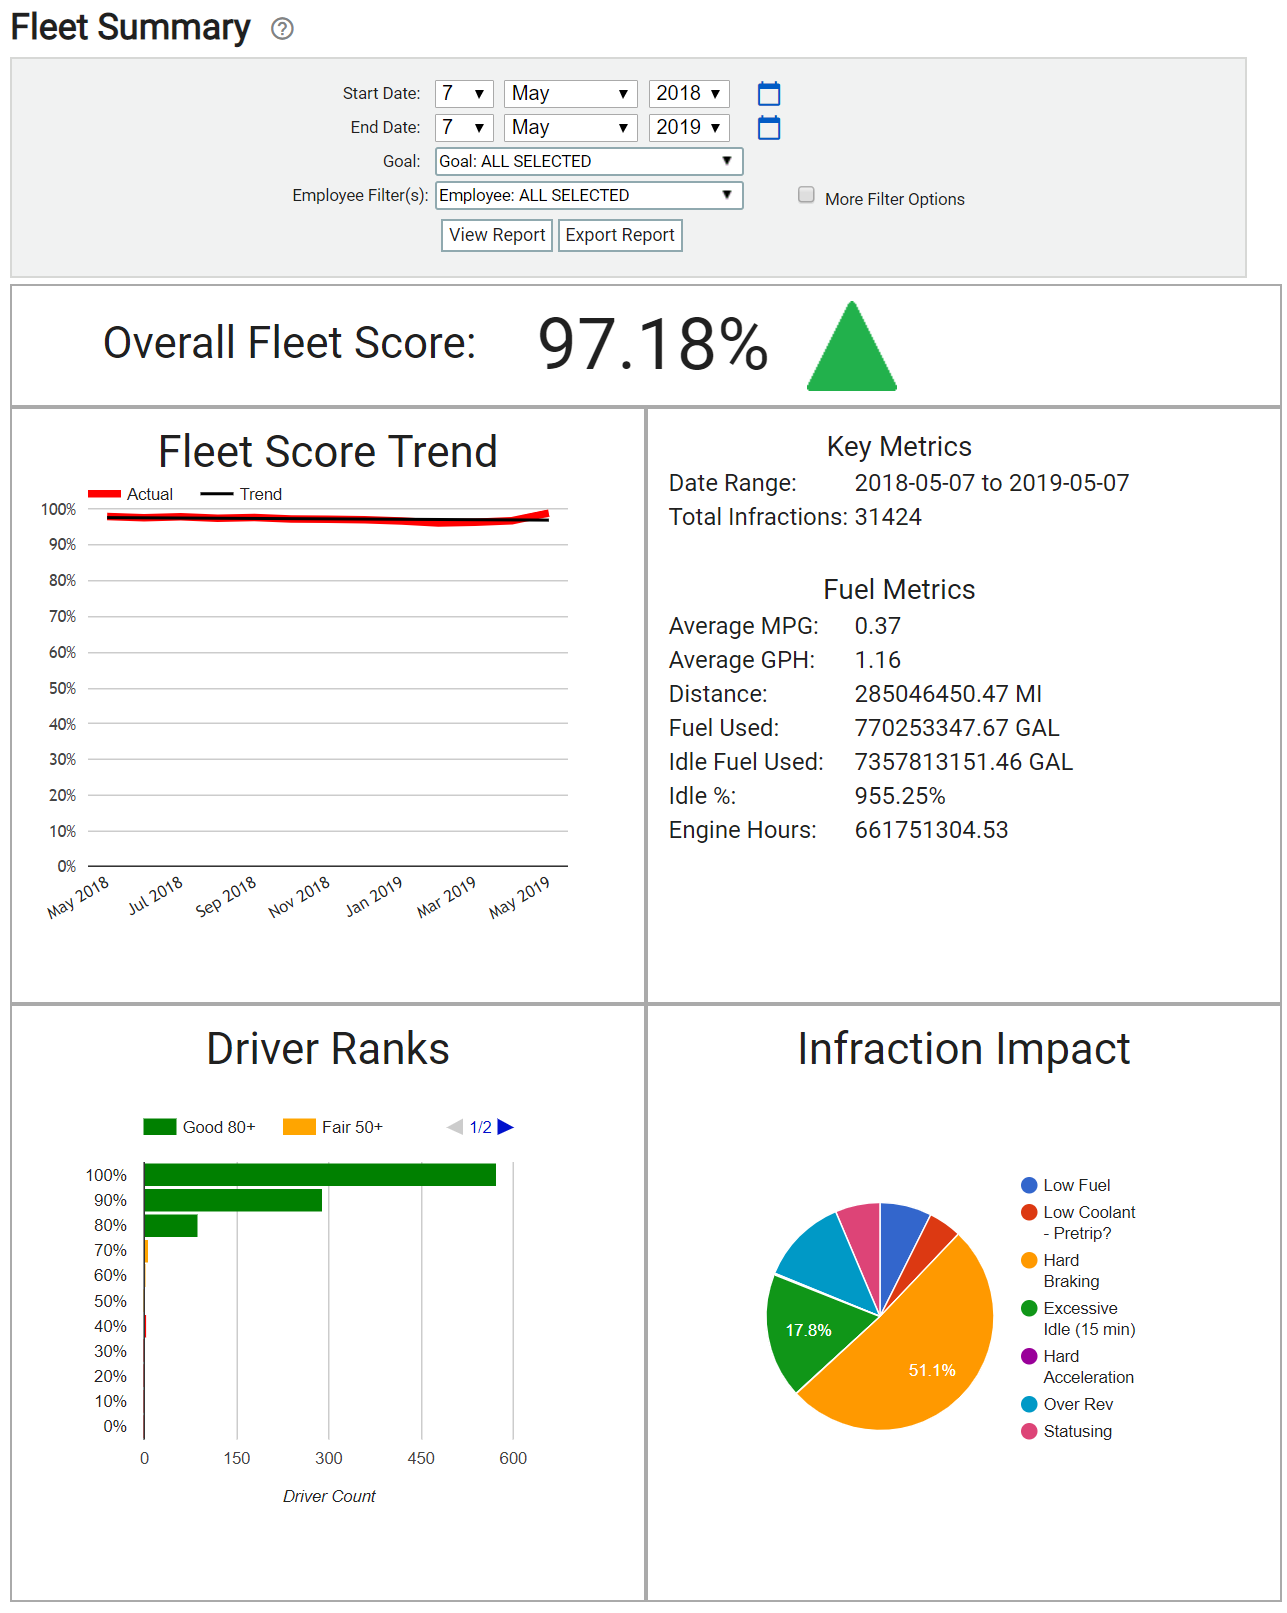
Scorecards consist of up to five components:
- The Overall Fleet/Driver Score panel consists of a simple percentage that summarizes overall employeeUser accounts for drivers, dispatchers, and other staff to perform varying functions in TrackIt. achievement of your defined driver goals. Next to it is an arrow to indicate increasing or decreasing performance trends.
- The Fleet/Driver Score Trend panel provides graphical chart of how employees are performing based on your company's driver goals.
- The Metrics panel summarizes key details such as the total number infractions made by employees in addition to fuel details like average fuel economy, distance driven, fuel consumed, fuel lost via idling, and total engine hours logged.
- The Driver Ranks panel for the Fleet Summary reportA report that summarizes and/or condenses collected occurrences. shows users what percentage of their drivers are hitting their goals. Selecting a bar from this chart launches the Driver Ranks dialog windowA pop-up window that requires user input., which shows each driver's percentage of goal attainment. When the
 icon to the right of each driver is clicked, this launches the Driver Summary report in a new browser window.
 - The Infraction Impact panel sheds light on what the most common infractions are and how many occurrences were recorded. When an infractionViolations of driver goals. Infractions can include excessive hard braking or acceleratiion, idling, and late logins. is selected on the pie chart, a dialog window appears that shows the top 10 employees creating events like speeding, hard braking, etc. This can be used for targeted coaching of drivers to improve vehicleAll machines used as a means of production on a construction site or at a batch plant. safety.
