Reports > Load Properties
The mixture quality and properties of your batching may be analyzed by equipmentAll machines used as a means of production on a construction site or at a batch plant. or ticketShort for “delivery ticket,” which is printed and given to the driver. Also called a tag or docket. The ticket includes, at a minimum, the product(s) ordered and the delivery address. It can also include the amounts of materials batched to form the mix. In the past, producers sent copies of the delivery ticket with prices as invoices; now tickets and invoices are two separate documents. using this report. The COMMANDassurance ProbeA probe device mounted in the side of a bin to measure the moisture content of aggregate materials such as sand. periodically records sample data which acts as a snapshot regarding the material slumpSlump is defined as the number of inches (or millimeters) concrete will sag, or slump, when a special test cone filled with the concrete is turned upside down and the cone pulled off the concrete. In other markets this is called ‘consistency’. Consistency for concrete can be stated different ways. Examples are: slump, flow, workability. We mostly use ‘slump’., temperature, water ratio, pressure, and more. The Drum Rotation Sensor acts similarly: it supplies the report with information regarding a the drum RPM, drum count, direction, turns charging, and turns discharging.
The loadThe total amount of concrete or asphalt that is being or has been batched for delivery. details are available via table and graph formats for greater context about the individual properties of a mix.
The Batch Summary report is linked to the Load Properties report via the View Load Properties ![]() icon to the left of the BatchThe total amount of concrete or asphalt that is being or has been batched for delivery. Summary table. When clicked, the Load Properties report will open in another tab. Additionally, the icon will turn red
icon to the left of the BatchThe total amount of concrete or asphalt that is being or has been batched for delivery. Summary table. When clicked, the Load Properties report will open in another tab. Additionally, the icon will turn red ![]() to indicate an alertA software-generated message or warning triggered by vehicle data. and will display the alerts on the Load Properties report when the red icon is selected.
to indicate an alertA software-generated message or warning triggered by vehicle data. and will display the alerts on the Load Properties report when the red icon is selected.
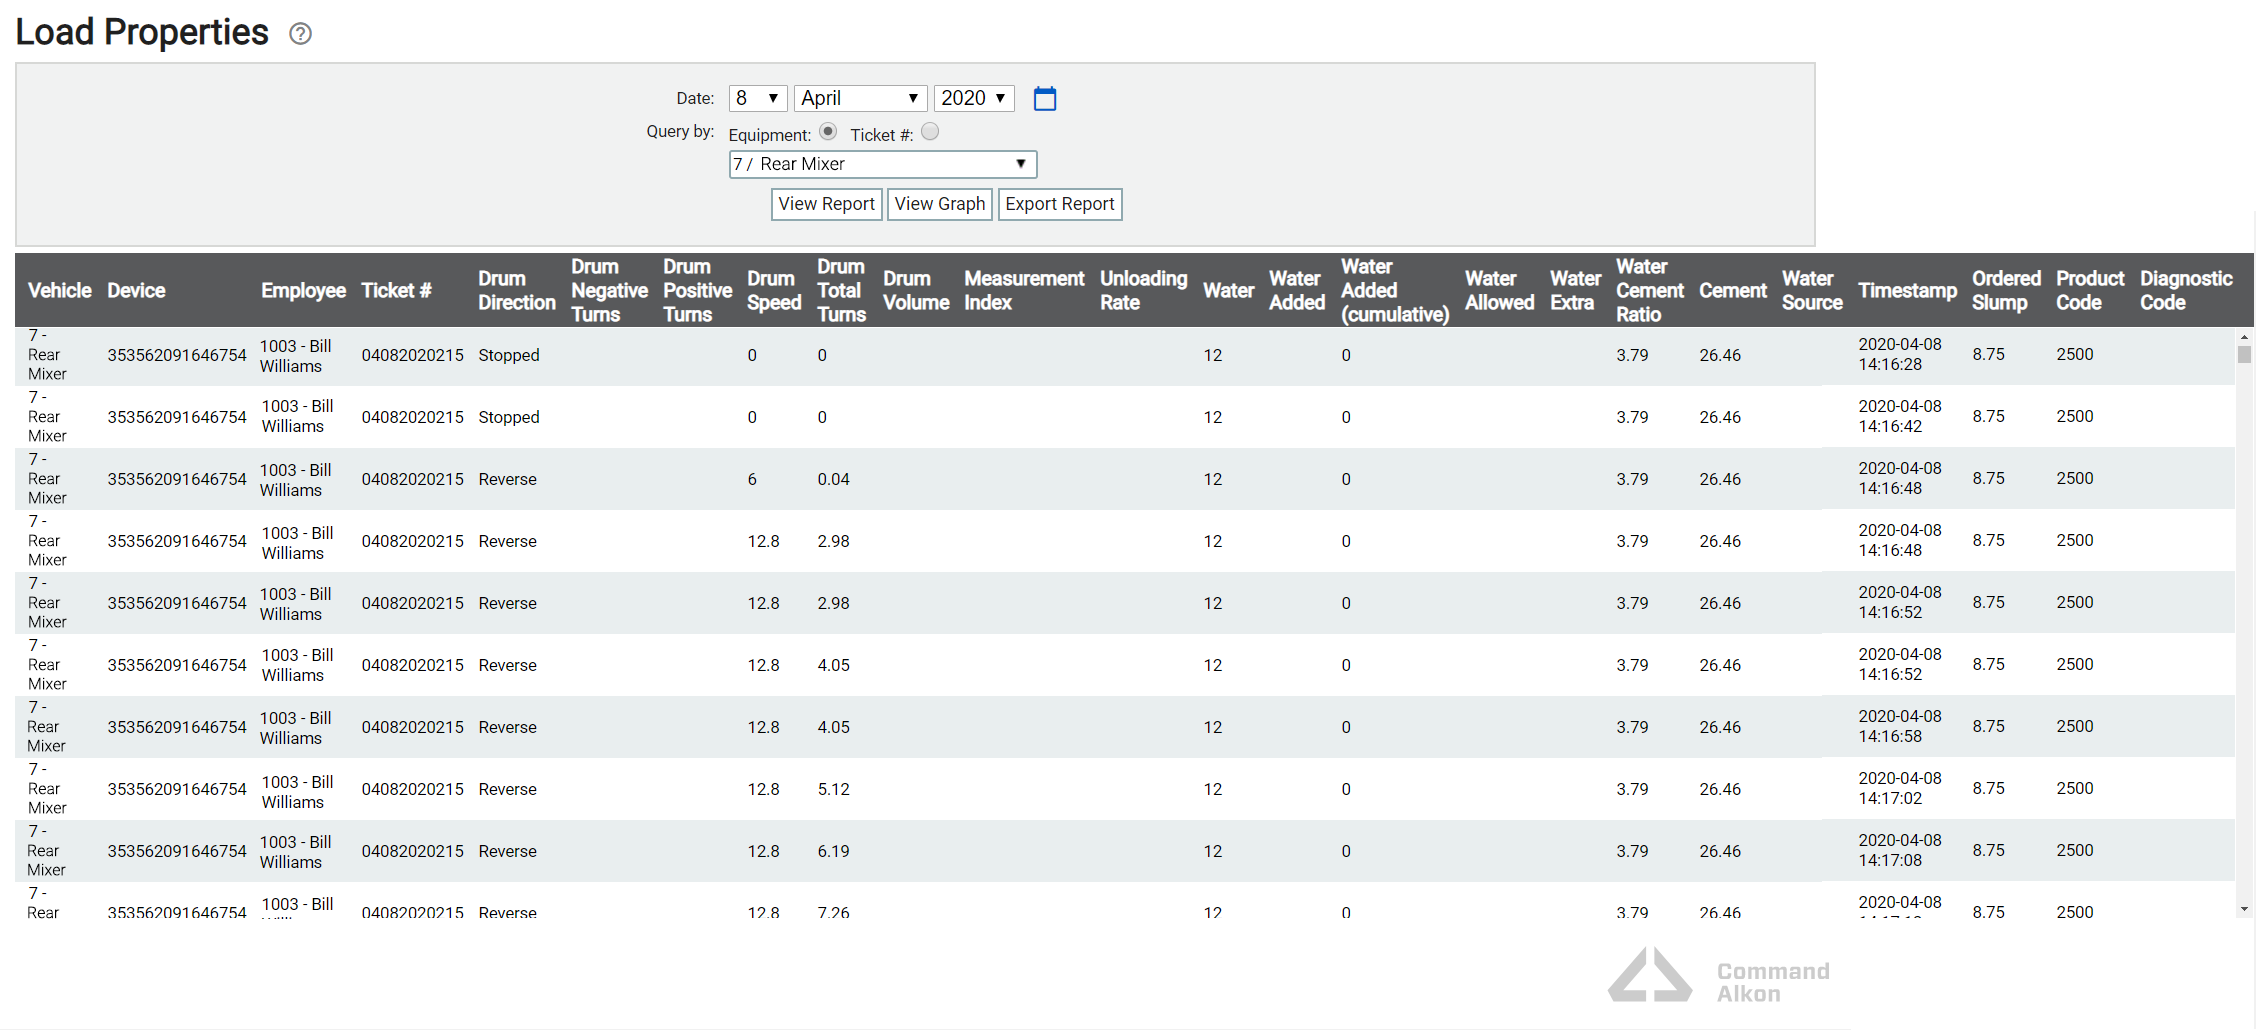
Table Report
To view the report results in table format, click the View Report  button.
Graph Report
To view the report results in graph format, click the View Graph  button.
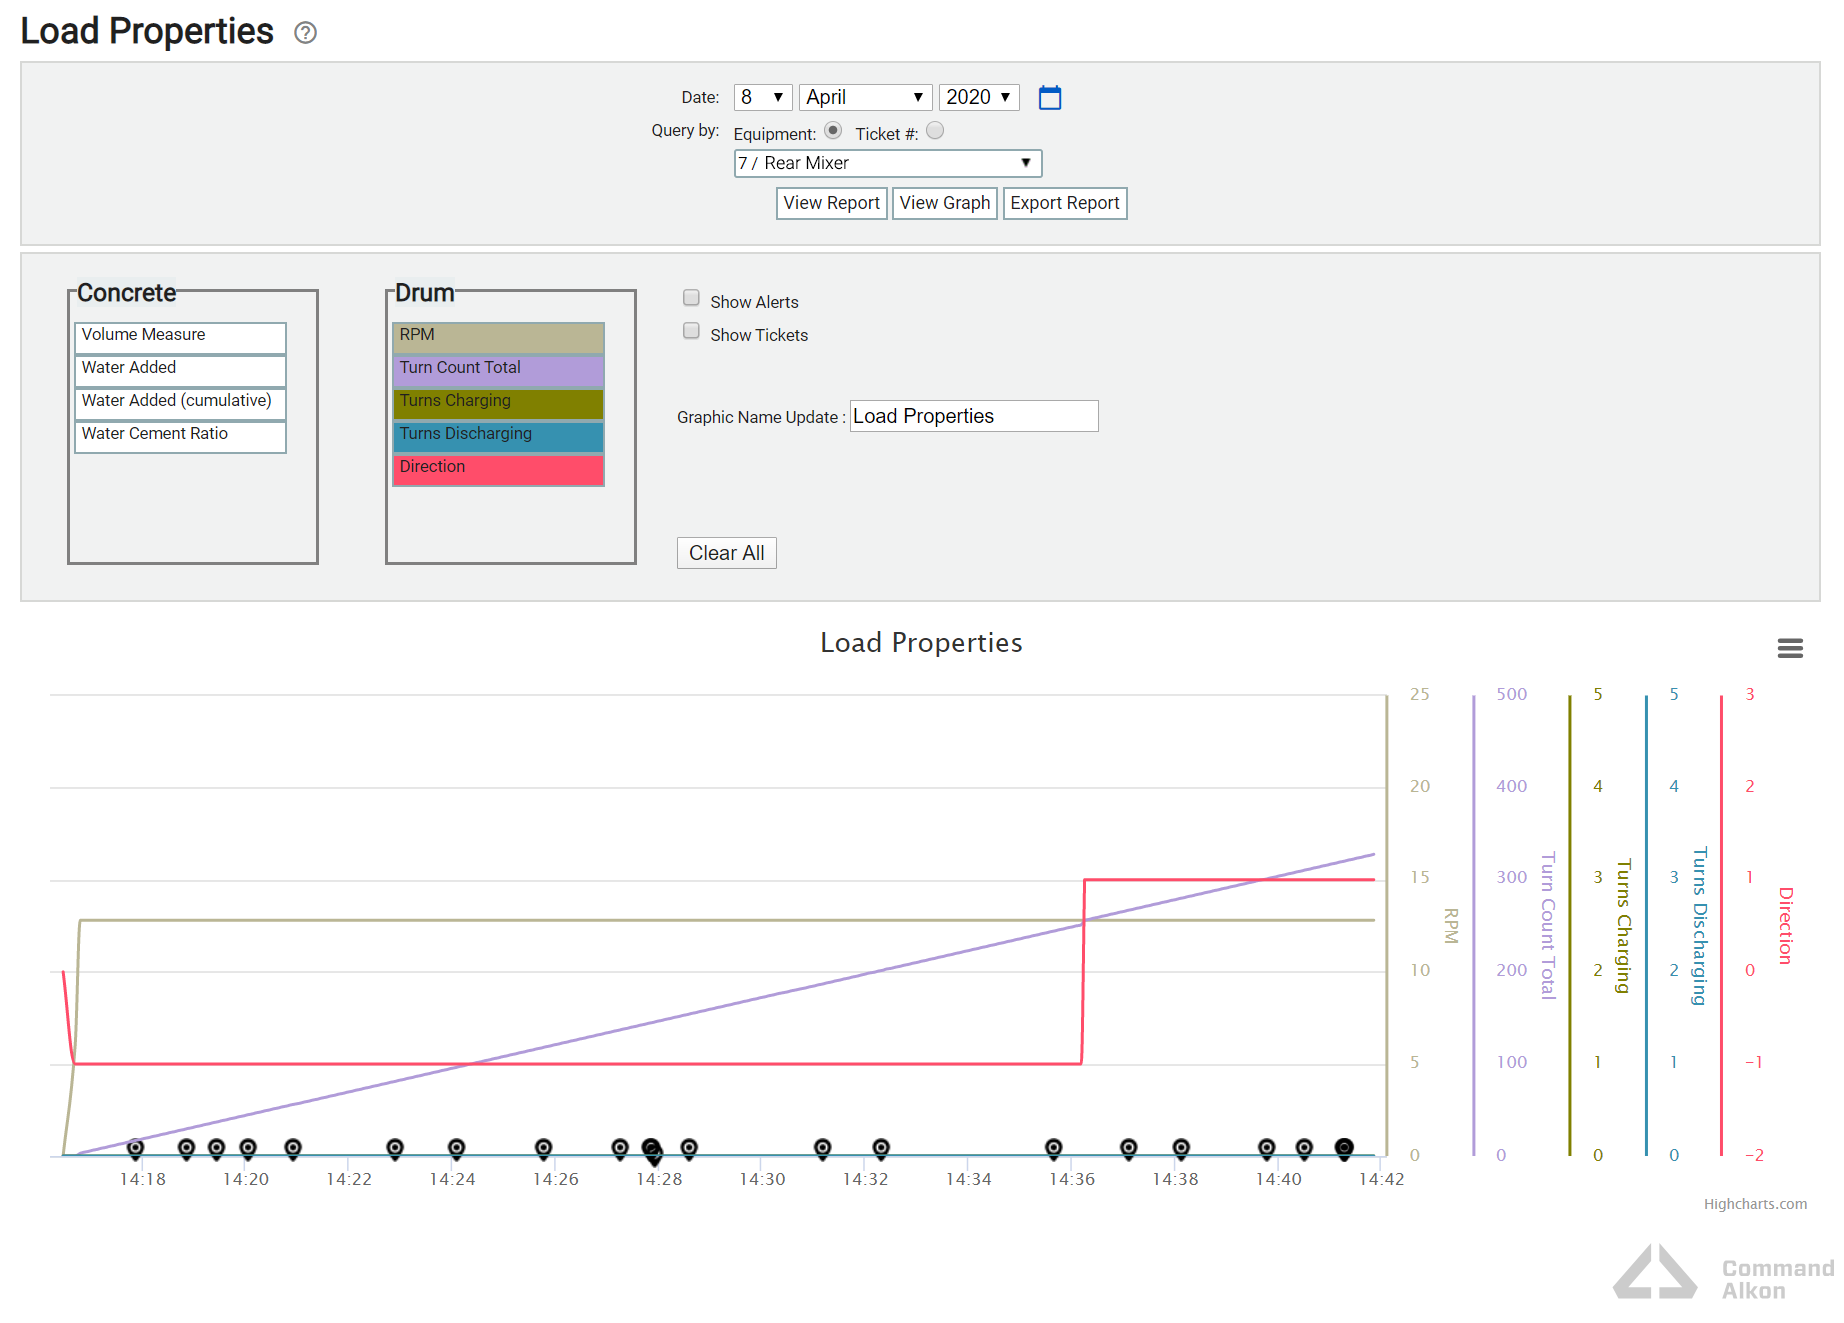
Drum Rotation Sensor Graph
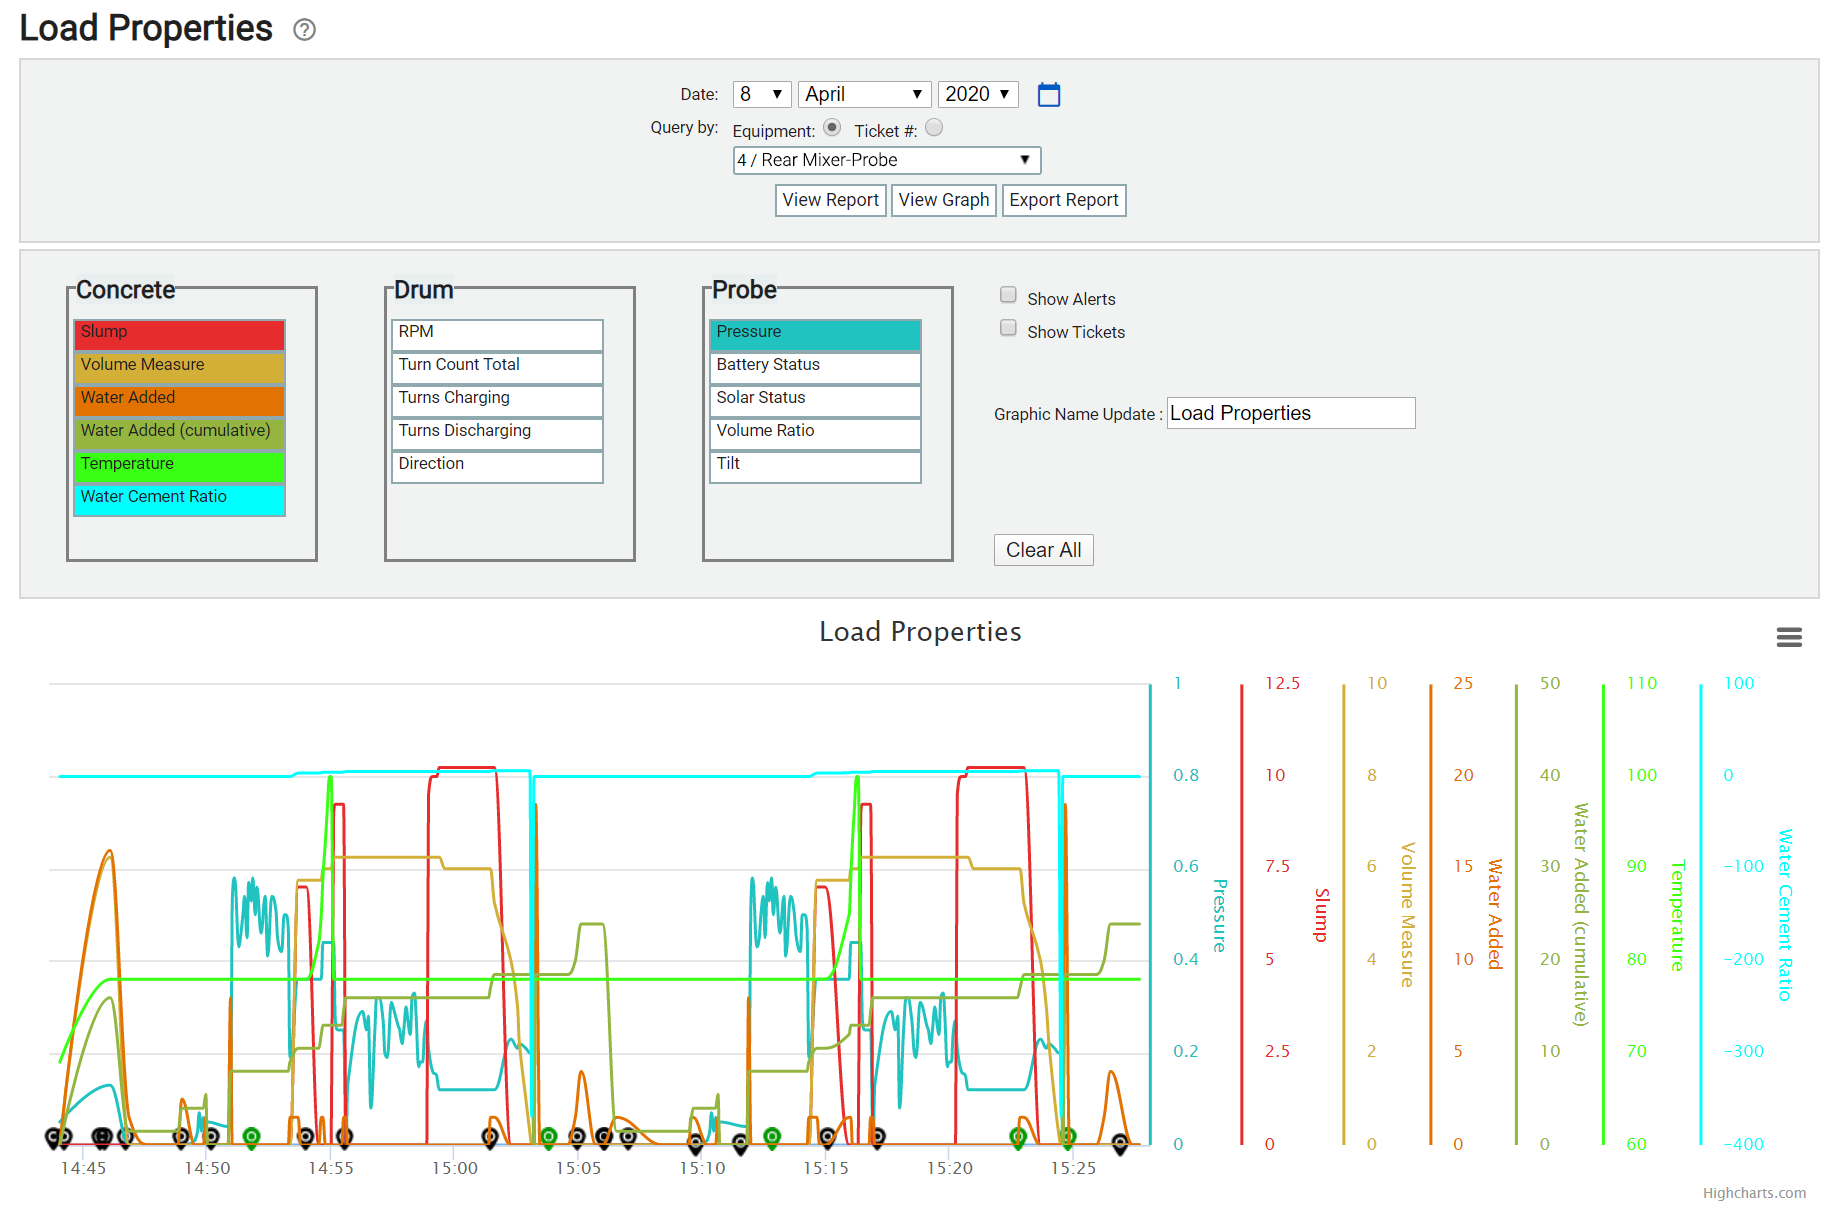
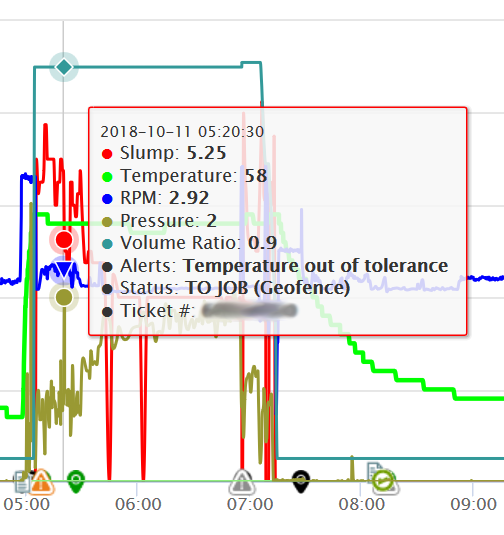
The graph tracks individual data types and their measurements over the period of a vehicleAll machines used as a means of production on a construction site or at a batch plant. trip. The right side of the graph shows the metrics for each property with high and low values shown for context.
You may hover the cursor along the graph lines to view a data window with all recorded probe information for the selected filters.
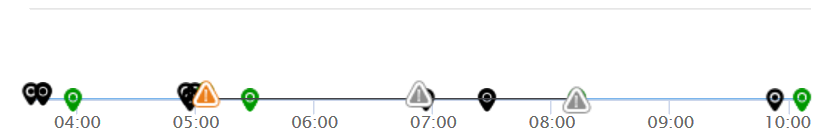
Status Changes
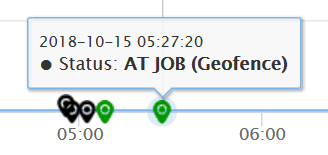
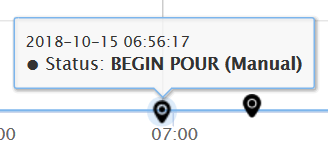
Along the bottom of the graph are map icons that indicate statusThe specific activity or task a driver is currently engaged in, typically as part of a process called a "status loop." changes throughout a load. The green icons indicate system-triggered status changes, whereas the black icons indicate manual changes.
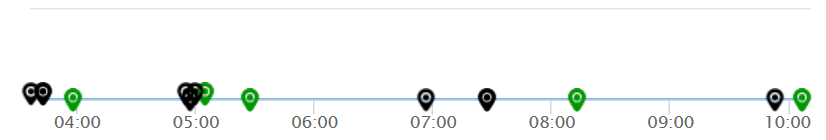
Automatic
When TrackIt forces a status change, such as entering or exiting a hotspotGeographic areas marked on a map that act as destinations for driver navigation or triggers for automated behaviors in TrackIt., the interaction is flagged with a state such as Geofence.
Manual
When the driver forces a status change from the tablet, TrackIt records the interaction as Manual.
Alerts
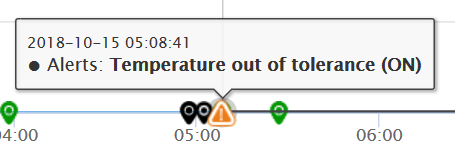
When the Show Alerts option is selected  for this report, any alerts triggered by probe data will display alongside status changes at the bottom of the graph.
On
Alerts are flagged as On when successfully triggered by TrackIt. This does not indicate whether a driver or dispatcher acknowledges the alert.
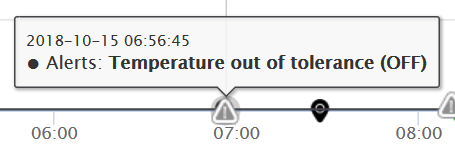
Off
Alerts are flagged as Off when other attributes of the vehicle override the alert, such as after an entire load is poured.
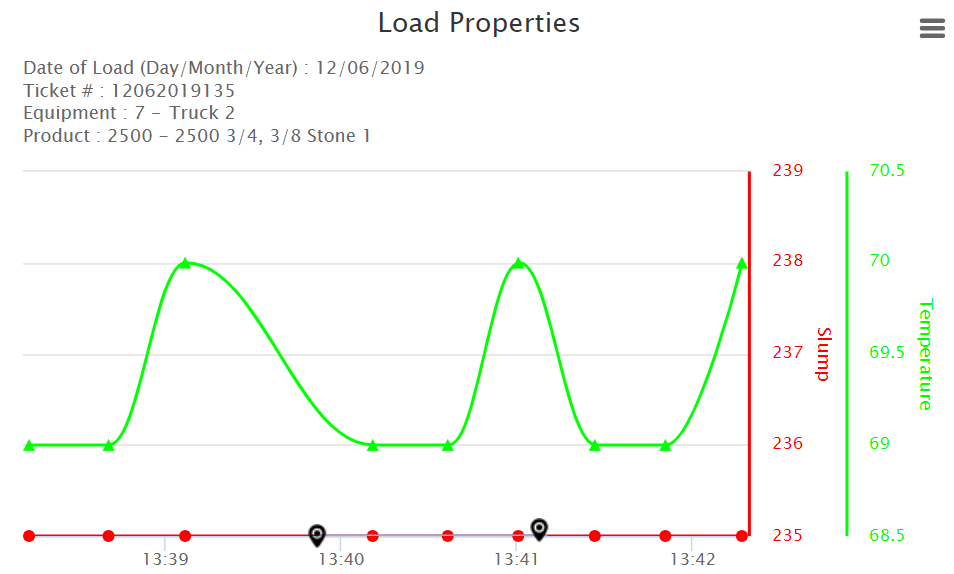
Ticket Information
When the Load Properties graph is accessed in two ways, ticket information for a load is displayed in the top left of the graph for easier referencing. The ticket number, vehicle, date, and product are displayed.
To access the graph with the ticket information:
- Click the Load Properties icon
 when in the Batch Summary report
 - Query by the Ticket # in the Load Properties report